Last week we introduced two different definitions of risk.
- Loss of principal
- Uncertainty about lifetime consumption
This week I want to place those definitions into the context of a lifetime financial plan to help with the understanding that, while investment bankers and analysts define the risk of a particular investment in terms of the loss potential in the near-term, I do not believe this definition applies to a family with an asset-allocated and broadly diversified portfolio trying to meet a lifetime of financial goals.
Here is the crux: Over time, the very thing that makes bonds appear “safe” – the fixing of your income stream – is destroyed by permanently rising costs. And, the very thing that makes stocks seem “risky” – the unpredictable but temporary decline of market values – dissipates.
As you move from looking at the relative performance of these two items from a daily or weekly basis, to an annual basis, to a 10-year basis or more… your application of the label “risky” naturally shifts from stocks to bonds, and your application of the label “safe” naturally shifts from bonds to stocks.
The “Safety” of Bonds Declines the Longer Your Own Them.
People believe that if they protect their currency units, they are being safe. They believe if they had $1,000,000 currency units in the year 2000 and still have $1,000,000 today, they are being safe. Except, of course, they have lost 65% of their purchasing power due to the declining value of the currency units they own. This, as we all know, is inflation.
Inflation has been lower than the long-term average for over a decade. As we know… it is now making up for lost time – In March the inflation reading was the worst we have seen since 1981. This chart showing the large recent uptick of inflation was taken from the US Bureau of Labor Statistics:
The long-term result of the declining value of each individual dollar’s purchasing power is shown in the following chart taken from the St. Louis Fed’s Federal Reserve Economic Data (FRED):
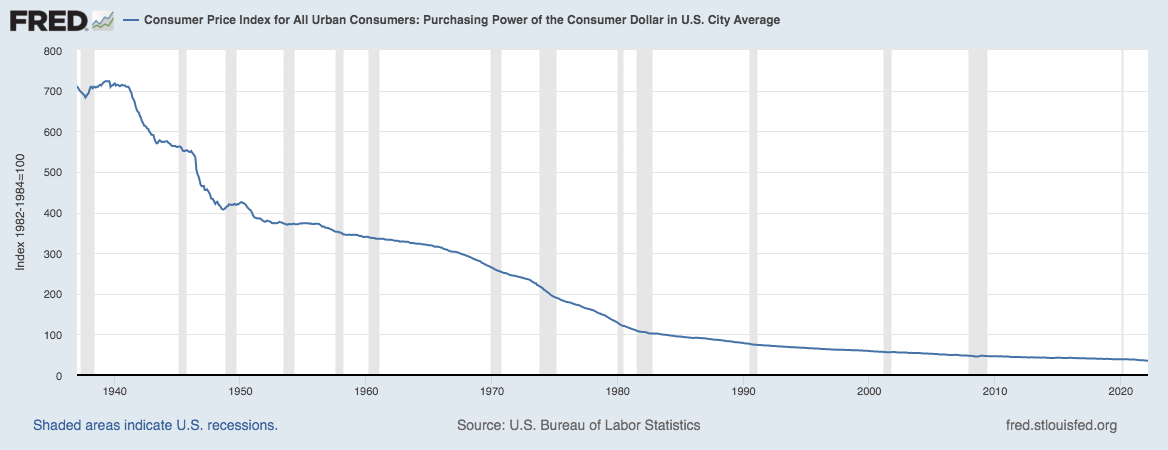
It takes 20 times as many currency units to buy the average thing today as it did in 1937. At an average rate of inflation (3%), after 20 years, you would need almost twice as much income to live the exact same lifestyle (because everything would cost roughly twice as much on average).
Fixing your income in a rising-cost world is financial suicide. The greater the percentage of your portfolio you committed upon retirement 20 years ago to bonds/fixed-income, the lower the probability your income would meet your expenses today.
If you were retiring today, the higher percentage of your portfolio you commit to bonds/fixed-income, the lower the probability your income will meet your rising costs in the future.
Bonds, understood in time, do not look “safe;” they look quite “risky.”
And,
The “Risk” of Stocks Declines the Longer You Own Them.
The first chart below visually describes the annual difference between US stocks and US Treasury Bills (T-Bills). The blue lines are all the times when the stocks do better than T-Bills, and the height of the line tells us how much better they do. We can see that between 1928 and 2021, the stocks outperformed the T-Bills roughly 70% of the time, and the horizontal dotted line tells us that the outperformance averaged 8.65% (almost 3X the inflation rate for the same period). This means that roughly 1/3 of the time, viewing it one year at a time, it felt bad (probably even scary) to hold stocks.
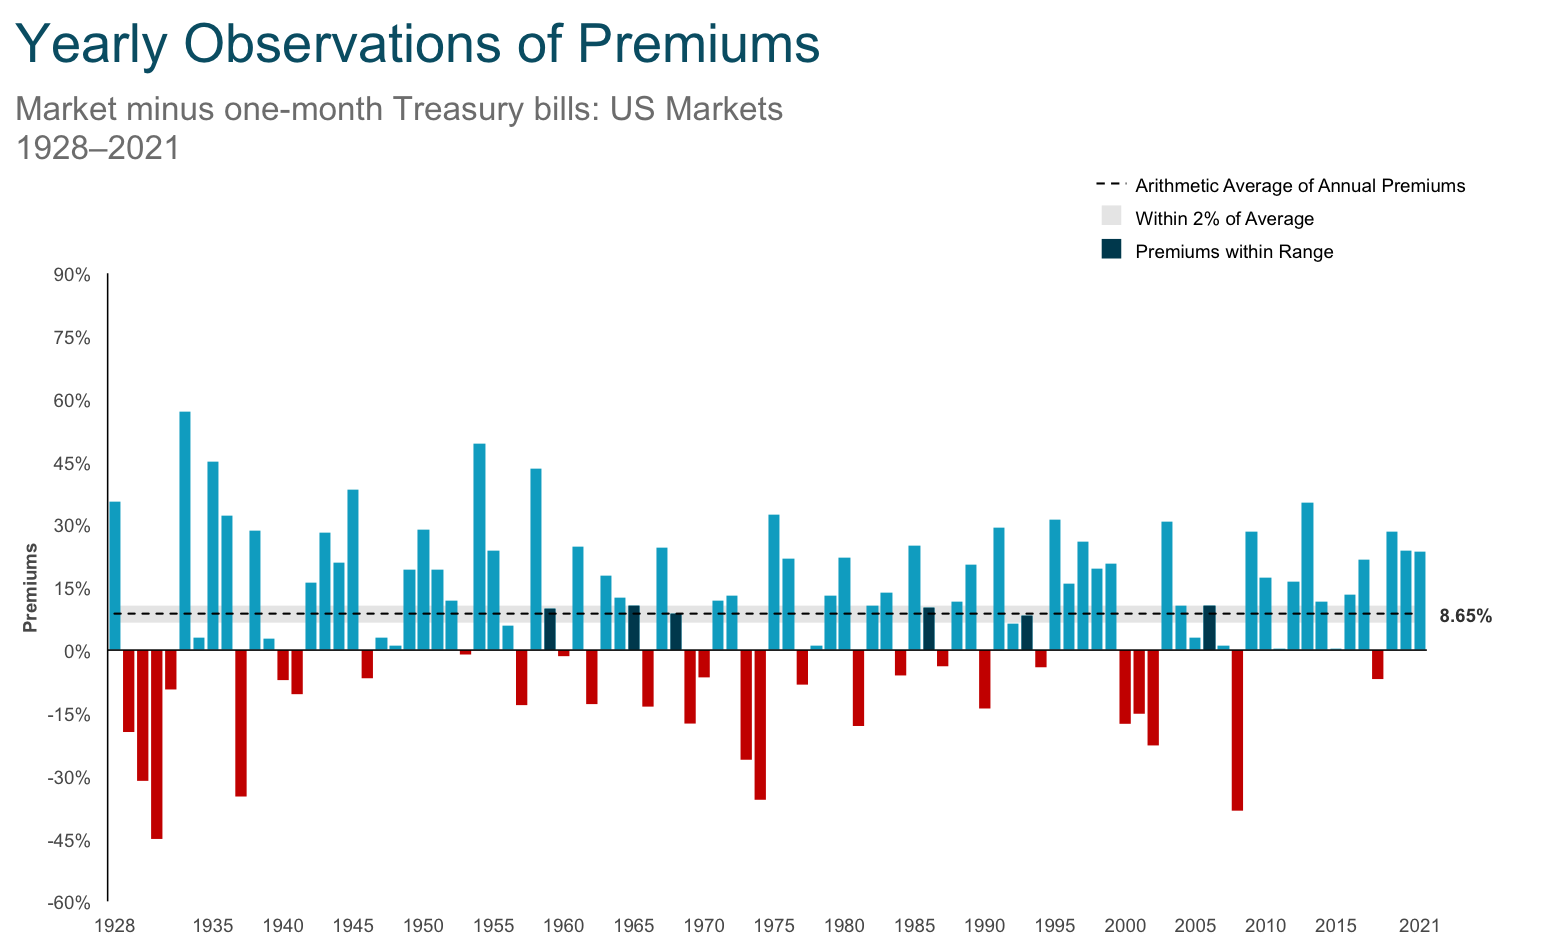
Information provided by Dimensional Fund Advisors LP. Past performance is no guarantee of future results. Actual returns vary. In USD. Indices are not available for direct investment. Index returns are not representative of actual portfolios and do not reflect costs and fees. Yearly premiums are calculated as the difference in one-year returns between the Market (Fama/French Total US Market Research Index) and the One-Month US Treasury Bill (IA SBBI US 30 Day TBill TR USD), provided by Morningstar.
When you zoom out and look at the exact same data on a 10-year basis (instead of every year), it becomes a lot easier to see that the “risk” of holding stocks is greatly reduced the longer your time-horizon. Looked at on a 10-year basis, your win percentage goes from 70% to 86%. The average outperformance remains very similar. It only feels “riskier” to own equities than fixed-income in 14% of decades. The longer your time-horizon, the less “risky” stocks/equities become.
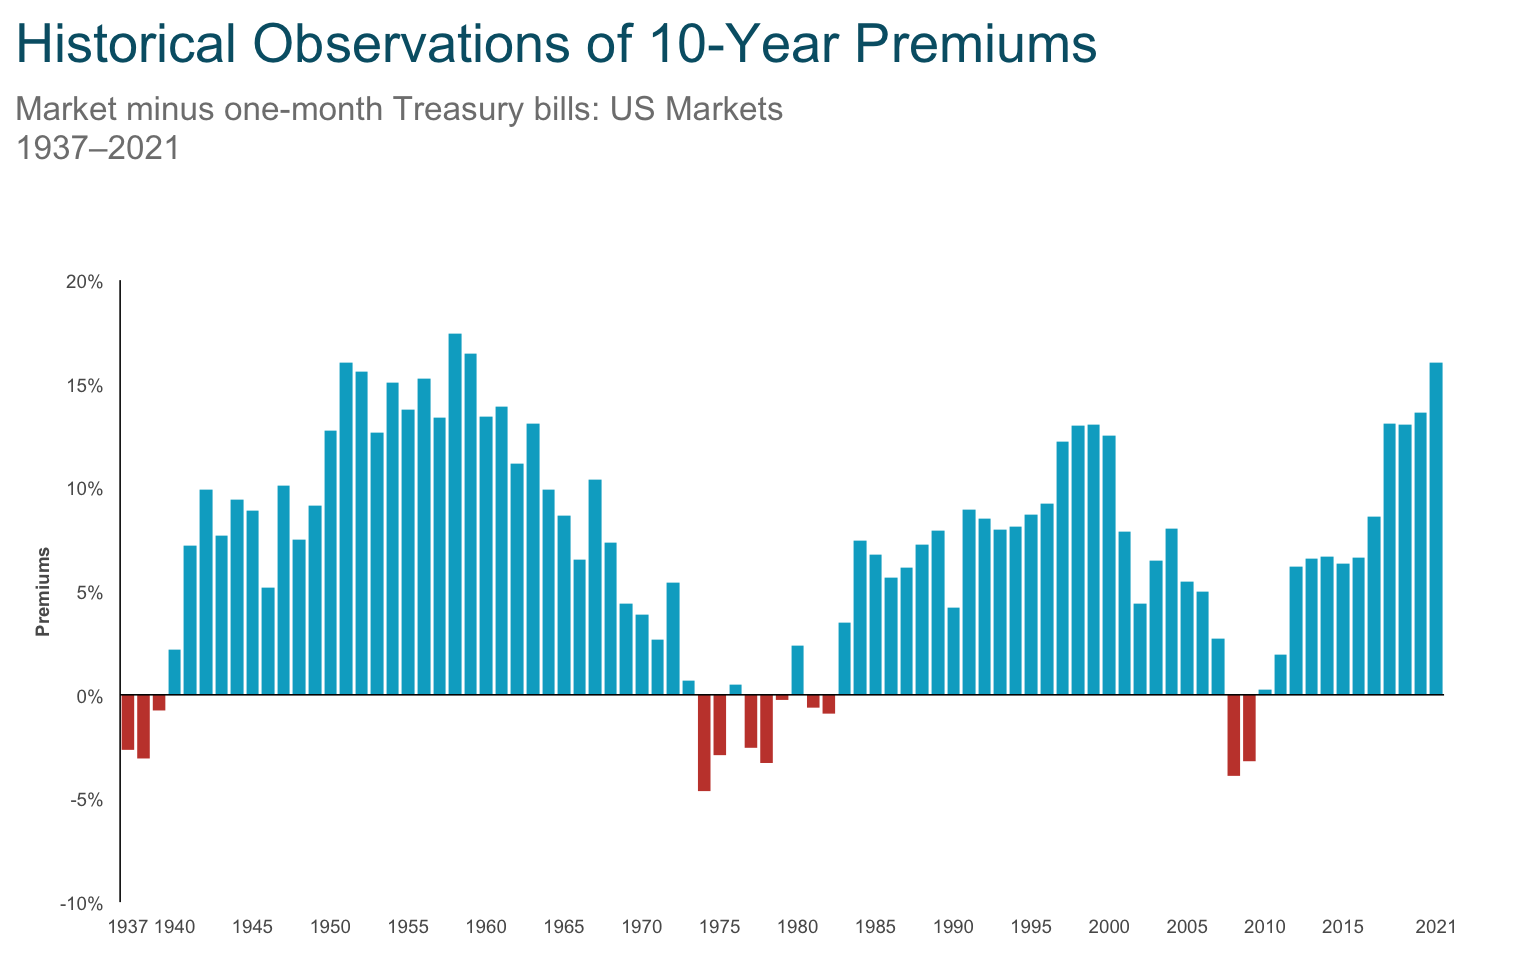
Same as above. 10-year rolling premiums are calculated as the difference in ten-year rolling returns between the Market (Fama/French Total US Market Research Index) and the One-Month US Treasury Bill (IA SBBI US 30 Day TBill TR USD), provided by Morningstar.
When we consider both the effect of inflation on bonds and the moderating effects of time on equity volatility, we have to conclude that the standard definition of risk as “loss of value” doesn’t apply as simply as the majority of the financial world attempts to apply it.
At the vey least, you should question it when someone refers to fixed-income as “safe” and stocks/equities/shares of great companies as “risky.”
Over what time-period?
What about inflation?
If we include the preservation and enhancement of purchasing power over a lifetime of investing within our definition of “safe” – which would be the only sane thing to do – then stocks become safer than bonds by a margin that widens the longer the time horizon you consider.
When you consider your definition of risk, recognize that there are trade-offs within the definition. You have a choice… you can have your risk today (in the form of uncertain principal value).
–OR–
You can have your risk tomorrow (in the form of uncertain retirement income).
Short-term volatility is the cost of long-term rising income.