With markets down into almost-bear-market-territory, nerves are fraying and questions are being asked.
It is perhaps time for another reminder that, “This too shall pass.”
The following is the market data surrounding all the bear markets (or near bear markets) in the S&P 500 since its inception on March 4th, 1957. In the 26 years since I started as a broker at Dean Witter, we have added 6 lines to correspond with the six bear markets I have faced in my career. We may be adding a seventh line this week if the S&P 500 closes below 3840 – which we very narrowly avoided last week.
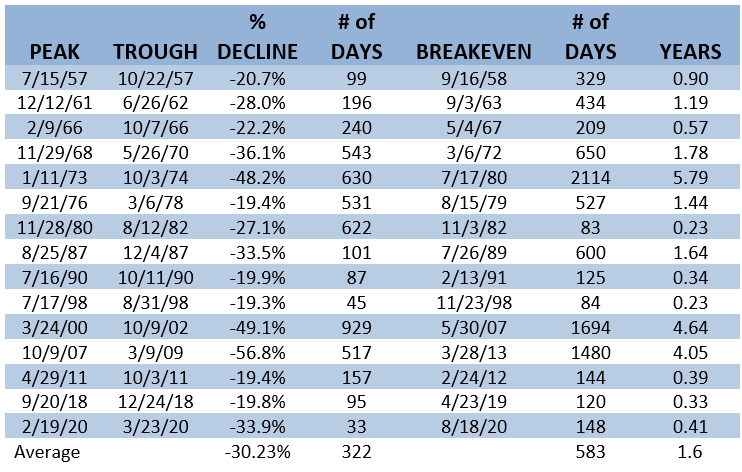
Starting from the left, we see the date the market peaks before a bear market begins, the date the market bottoms, the percentage decline (on a closing basis) between those two time periods, the number of days that elapse between the peak and the trough, the date the market finally regains its former high, and the number of days (and then years) it takes to do so. By all means, take a moment – especially if you haven’t seen the chart before – and review the information.
At the very bottom, we see that the average “bear market decline” delivers a roughly 30% loss of value, takes roughly 322 days to do so, and requires 583 days (or 1.6 years) to complete the round trip to recovery.
Every single time the market has declined, it has recovered and gone on to new highs. There have been no exceptions to this. This is normal volatility.
Just looking at the average depth and duration has always been enough for me. The evidence doesn’t support the idea that today’s calamity won’t end in recovery. Why sell – creating an unnecessary taxable event and forcing the impossible “timing of re-entry” decision – because of normal volatility?
But, this isn’t the whole story. Perhaps the most important story of business activity across time is that of increasing earnings, dividends, and prices between one market trough and the next.
At a moment where markets are declining and pundits are wailing, it may not be enough to remind you that the pain is temporary. It is equally important to remember that the advance (of earnings and dividends at least) is permanent. I hope this additional data can be supportive of better (i.e. calmer, more patient and disciplined) investing behavior.
The three columns below represent the year-end price, the total earnings, and total dividends from the S&P 500 companies for the year of the associated market trough from the above chart. If you want to check my data, the source is the Stern School of Business at NYU.
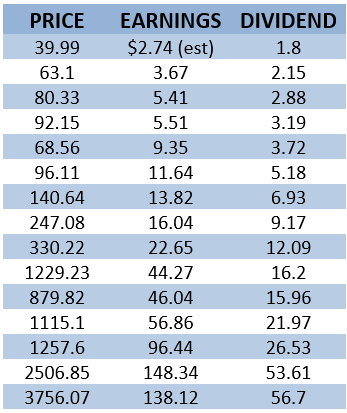
Note how consistently all three columns go up (with very few exceptions) as one trough passes and another trough comes into view. The ONLY earnings decline between troughs is associated with the COVID-19 pandemic where businesses were forced to close across the country and families were forced to stay home. And even then, earnings only fell by 7% and advanced to over $200 in 2021 (from about $160 in 2019).
You can review each column from trough to trough, and in most instances you will find positive results. However, I like to look at the data over longer timeframes. If you are 60 years old, you could look back to the trough closest to your birthday, compare it to the most recent trough, and see how the S&P 500 earnings, dividends, and price have advance in that period. Or, the example I like to use is the average 30-year retirement.
Example: The average retirement age has hovered for years right around 62. The couple retiring at this age has a joint life expectancy of 30 years. This means that one member of the average retiring couple will need an income stream for a retirement that lasts 30 years.
The trough closest to 30 years ago occurred on 10/11/1990 (the 9th row of data). According to the Price-Earnings-Dividends-Chart the S&P 500 earned $22.65 / share and paid out $12.09 in dividends the year that trough occurred. 30 years later, the most recent trough occurred on 3/23/20 (the final row) and the S&P 500 earned $138.12 and distributed $56.70 in dividends. That is a 6.1 times increase in earnings and a 4.7 times increase in dividends in that 30 year period. The price of the shares themselves went from $330.20 to $3756.07 – increasing over 11 times. In the same time period inflation caused a mere doubling of the cost of living (See CPI tables in Stern School of Business at NYU link above).
Let me say that again. From the bottom of the trough in 1990 to the bottom of the trough in 2020 the cost of living increased 2 times while equity earnings increased 6.1 times, dividends went up 4.7 times, and prices went up 11 times. All you had to do to experience this tremendous increase was sit through 6 bear markets (2 of which saw your portfolio decline in the neighborhood of 50%).
I certainly don’t know any specifics about the future increases of any of these items for the next 30 years. No one does. However, earnings are driven by the purchase of goods and services and dividends are driven by a company’s need to attract patient capital and reward investors (none of these seems likely to change in any real way). If we had begun harboring doubts about whether inflation was an ongoing concern, we have now been reminded that it is THE most important concern – indeed you’ve heard me say over and over again that inflation is the dominant hurdle in the creation of a sustainable retirement income.
The reason we own equities is because their long-term returns are multiples of inflation and they are inextricably tied to the rising earnings and dividends of the underlying businesses they represent.
The cost of owning equities is the volatility that occurs as different market participants continuously make short-term directional bets.
Any sale in response to today’s headline news – be it inflation, the expected FED response to inflation, Russia’s continued aggression in Ukraine, the collapse of the hyper-growth companies, or pick-your-headline-calamity – is a short-term directional bet.
Insulating you from the need to make short-term directional bets is my way of minimizing your long-term regrets.
Our mantra through ALL volatility is “This too shall pass.”